

The Most Important Sales KPIs for Each Stage of the Funnel
Profitable sales operations require insights. Numbers tell you which screws to fix, where to invest, who to promote, who to demote. But numbers can also be deceptive.
Working with metrics is a lot like handling microscopes. If you zoom in too much or too few, you’ll miss something essential. Place a wrong object on the slide and you never had a chance to get meaningful insights to begin with.
Finding your sales KPIs means finding the perfect zoom level at those spots with the most leverage in your sales process . Here’s what you need to measure to keep all systems in check at any time.
Prospecting KPIs

Prospecting is like holding a sieve over your sales funnel while you pour in raw customer material. Extensive research results in a finer grain and more suitable outbound prospects. Then again, less research means more time for reaching out, hence more chances to score.
Prospecting KPIs measure when and to which extent these equations apply. They serve as a basis for allocating your agents’ time wisely.
In order for them to do so, link them up with KPIs further down the funnel. Then they’ll also allow you to compare your agents’ performance in this first stage.
1
Research-Response Rate ROI (RRROI)
The percentage by which your response rate on emails or other messages grew per additional hour spent on research before reaching out. This metric tells you how to distribute time between research and contacting.
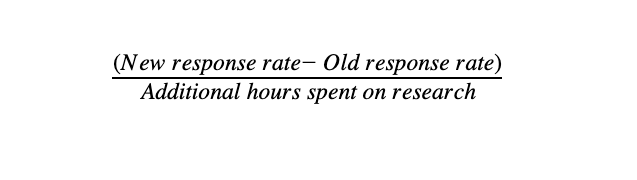
Increase the time that your agents spend on research before reaching out for a certain period. Run a contacting round on the prospects gathered here. Then, divide the difference between their new and old response rates by the number of additional hours you had them work on research upfront.

Free Guide to Sales Training
Download our free guide to get a full-body workout for your sales skills.
Get your guideA positive rate suggests investing more time into research, a declining one suggests spending more on reaching out. You can additionally distinguish response rates per channel or turn the metric around to check whether you can invest less hours in research without hurting response rates.
2
Research Time to Generate x Leads of x Quality
An agent’s or team’s research effort put into relation to their lead production quantity and quality. This metric serves the same purpose as the RRROI but links up research time with actual lead generation figures.
First order leads by quality with descriptions like hot, warm, cold etc. This post by HubSpot’s Pamela Vaughan explains how to assess a lead’s quality. Take the number of same quality leads an agent generated from reaching out to a certain number of prospects. Divide this by the number of hours the agent spent on digging up those prospects:

To get the denominator, simply let your agents jot down the numbers of hours they spend researching until they reach, say, 500 prospects to contact.
Reach Out KPIs
These key metrics evaluate the productivity and effectiveness of your sales team in first-contacting prospects, both inbound and outbound. They encompass and assess anything that’s lead generation but not lead qualification.
1
Email Open Rate
The percentage of emails sent that were opened by the recipient. Remove bounced emails from the equation.

A high rate suggests general prospect fit and confirms that first contact has been established as well as that your subject line was enticing. These may seem like low hanging fruits, but don’t take people’s attention for granted. Compare your open rates to the industry’s average with HubSpot’s online tool .
2
Response Rate
The percentage of emails or other text-based messages that triggered an answer. Again, remove bounced emails from the equation.

This is a reliable indicator of interest in the content of your reach outs, the offers presented in them and their general soundness. The response rate is moderated by prospect fit, which describes how much your products and offers suit the recipients. Filter out this confounding variable by excluding unopened emails from the calculation. This way you specifically analyze the effectiveness of your content.
3
Reach Outs per Week and Contact Channel
The amount of reach outs accomplished within a certain time. These mere productivity metrics might be shallow, but they do serve a purpose. If you’ve already found your perfect research/reach out ratio, or if yours is the scatter-gun approach, and you want agents to get out as many cold-calls and messages in a defined time – this is how you track their performance.
Lead-based KPIs
Assess the effectiveness of your lead qualification and your sales communication. These metrics are not tied to revenue and focus on the steps of preparation leading up to the deal, the swing before you strike.
1
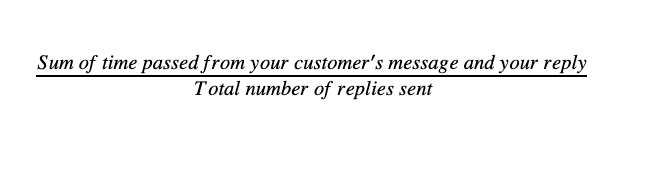
Average Response Time (ART)
The average duration until you reply to your lead’s most recent message. Your follow-up speed is an important metric because sales leads live incredibly short lives . Long waits dramatically decrease your chances to convert.
2
Qualification Rate (QR)
The percentage of opportunities (opened emails, phone conversations with the target person etc.) that qualified as leads by your definition. For example, by replying and indicating interest within a certain time or within a certain amount of contact attempts.
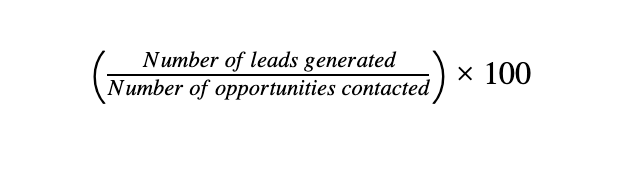
This KPI informs you both about your ability to qualify leads as well as the quality of the opportunities you generated. Calculate it for leads of different quality (hot, warm, cold etc.).
3
Leads Qualified per Month (LQM)
The overall number of leads an agent or team pushed forward, either from opportunity to lead or from one lead status to the next. While the qualification rate incentivizes thoroughness, the LQM’s absolute value incentivizes your sales agents’ speed.
4
Average Number of Follow-ups (AFN)
The average number of times you had to contact a prospect or lead to push them forward in your system. Add up the numbers of follow ups you sent to each opportunity or lead that was qualified during a certain period and divide it by the number of opportunities or leads qualified in that time as a whole.
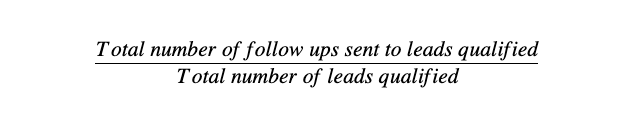
This metric allows you to put a cap on the number of times you retry to get a hold of prospects and leads. This prevents you from chasing people unlikely to convert.
Purchase KPIs
These are the KPIs that focus on actual deals, your ability to convert leads to customers. They’re crunch time metrics, those that sales reps often brag about. And, ironically, those that are commonly overestimated in their predictive power for business success. Track them, but don’t let a high score make you ignorant of the sales stages preceding the purchase.
1
Conversion Rate (CVR)
The percentage of opportunities or leads that took a desired action in your sales process. Probably you’ll define this as a buy or deal.

CVR is a very common sales metric in eCommerce. Its predictive power for a company’s prosperity, however, is often misunderstood. In his Medium post , Larry Kim explains why CVR is valid only when your lead quality is high.
2
Repurchase Rate (RPR)
The percentage of your customers that buy again within a set period of time. Usually, sales managers define different time limits for the second purchase and separately calculate the rate for each.

According to iPrice’s Matteo Sutto , repurchase rate is “the single best metric to assess product / market fit”. In other words, a high rate is proof that you offer the right product to the right people in the right way. That’s a pretty complete success predictor.
3
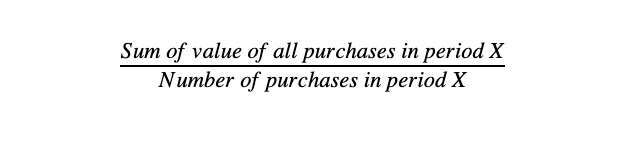
Average Purchase Value (APR)
The average monetary value of a purchase. This metric for retailers translates to average deal size for B2B sellers.
If you intend to target the most valuable customers instead of the easier low-value ones, it gives you a hint where you’re at. If you track the number of deals closed, reps might go for easy ones first, not the most lucrative.
Customer Lifetime KPIs
Skyrocketing sales don’t necessarily mean viable business if realized only through heavy investments. Hindsight is always 20/20 – and these long-term meta metrics are pure hindsight. They put the whole operation to the test.
1
Return on Investment (ROI)
The percentage of a capital expenditure that it yields in profit. The formula goes:

This metric is especially useful when you consider enlarging your team. A positive ROI means scalability. If you hire a new sales agent for an annual $40,000 and she brings in $50,000 in her first twelve months, the ROI of the hiring for that year is 25%.

Looking for better customer relationships?
Test Userlike for free and chat with your customers on your website, Facebook Messenger, and Telegram.
Read moreAs Vincent Nguyen explains , ROI doesn’t help to track the impact of marketing investments on sales. Applied solely to sales, though, it’s a reliable indicator of the bottom line profitability of that department.
2
Annual Recurring Revenue (ARR)
The sum of the yearly revenues from all active subscriptions generated in a certain period per team or agent. The ARR formula of one customer:
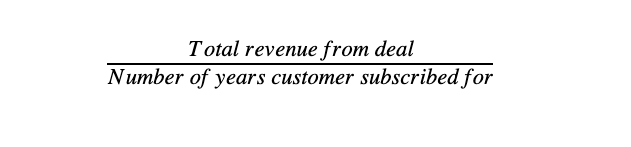
This metric is mostly used by Software as a Service companies and other subscription vendors because it cures an issue that’s common among them. Namely, that to reliably calculate the expectable income over the course of a year (or month) despite having customers that pay varying amounts of money in varying intervals and over varying extents of time.
Besides that, ARR also allows to calculate an ROI for subscription customers. That’s particularly useful after months spent on massaging a lead. By that time, you want to know when you start actually earning money with that new acquisition. SaaSoptics shared some examples that help better understand the calculation.
3
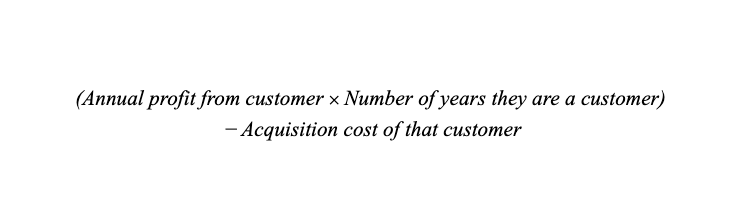
Customer Lifetime Value (CLV)
The current value of all future revenue generated through one customer over the entire relationship with your company. In order to be a meaningful metric, the CLV requires knowledge about your own or other companies’ long-term customers. If you can’t tell how long a certain customer type will stay and what they’ll desire on their journey with you, how would you know how much they’ll spend during that time?
With that insight though, for instance gathered from customer retention metrics, you can decide which customer is worth some extra effort, and which isn’t. If you also categorize the steps you expect customers to pass through, you can place upselling attempts at the perfect moment.
4
Customer Acquisition Cost (CAC)
All investments spent on customer acquisition divided by the total number of customers acquired.

The CAC is basically an inverted ROI metric. While the ROI tracks the monetary gains or losses as result of your investments, the CAC makes a statement about the investments that are necessary to create certain gains. Both can be used in retrospect or as future predictions.
As Chase Hughes illustrates in this Kissmetrics post , however, the CAC requires a metric like the CLV until you can use it as a crystal ball.
Calculating your brand’s customer acquisition cost allows you to assess their acquisition spending at the most granular level on a per customer basis.
Demi Oba, smile.io
5
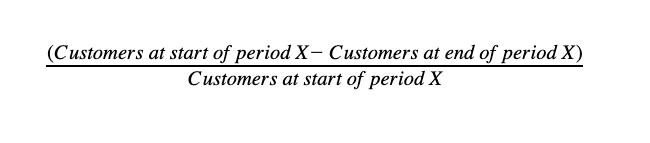
Churn Rate (CNR)
The percentage of customers that leave you. “Leaving” can be defined as a cancelled subscription or as inactivity for a certain amount of time.
This negative metric is helpful in deciding if you should concentrate your efforts on customer retention (high churn rate) or on acquisition and upselling (low churn rate). Furthermore, distinguish churn rates by your customers’ monetary value to see who’s typically leaving you and how much they would be worth investing more in.
